Data Models and NFL Betting Analytics Tools
 Available in US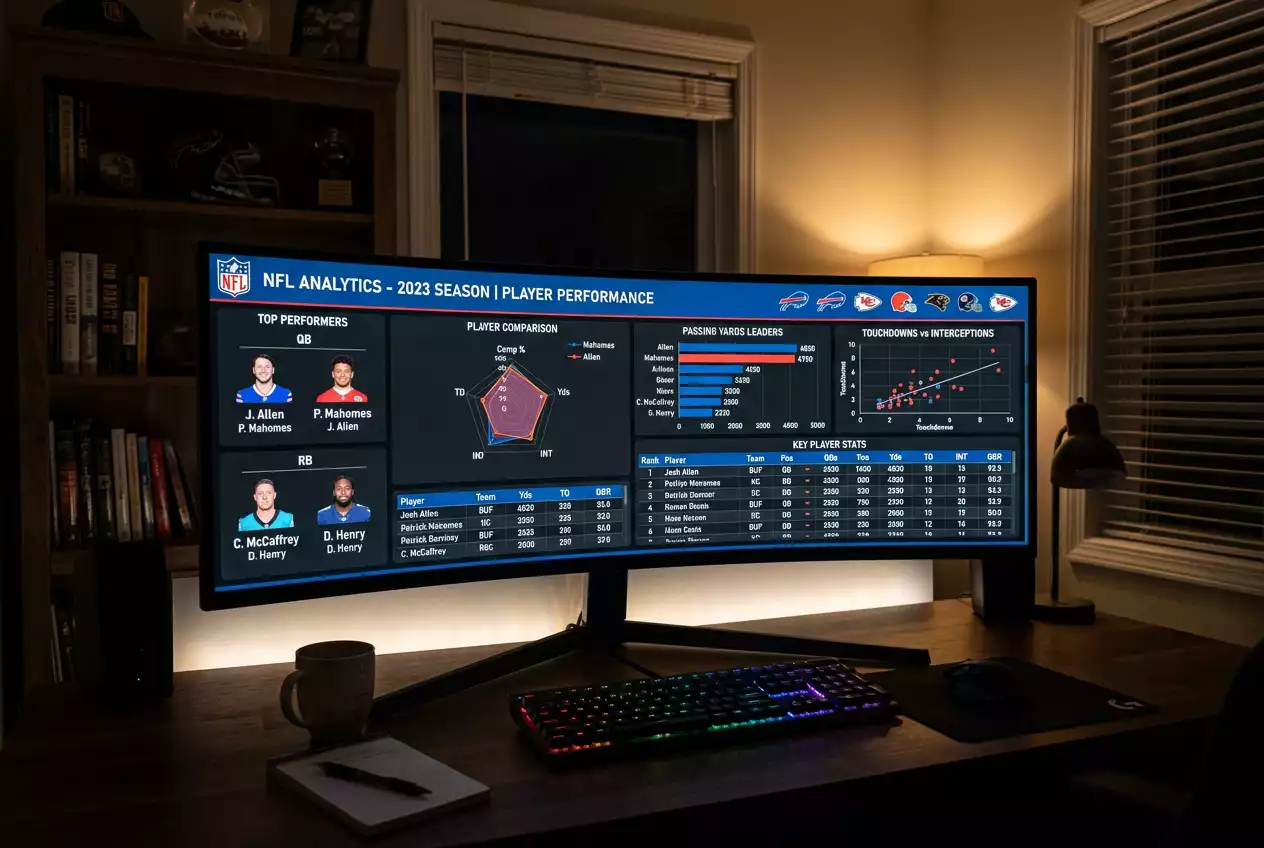
Applying Next Gen Stats to Pre-Game Betting Research
The first NFL analytics tool most UK punters encounter is a basic stats table showing touchdowns, yards, and quarterback rating. Those numbers are fine for casual conversation about the game. For betting purposes, they’re nearly useless — partly because they measure outcomes rather than process, and partly because they’re already priced into the market by the time you see them.
As Mike Lombardi, former NFL executive, put it: American football is “chess on grass.” The information that moves betting lines is forward-looking — efficiency metrics, situational performance, matchup data — not the backward-looking box score that casual fans check on Monday morning. The tools that actually help your research are the ones that quantify process rather than just results.
Kansas City Chiefs are the most searched NFL team in the UK, accounting for 9.5% of all UK NFL team searches, according to analysis of Google data from late 2025. The availability of analytics tools for teams with large UK followings makes research more accessible — but also means the market has already absorbed most of the information. The edge comes from using the same tools on less-covered matchups.
Free NFL Data Tools Worth Using
Pro Football Reference (PFR) remains the most comprehensive free historical database for NFL data. Box scores going back decades, split statistics by game situation, and team-level pace and efficiency metrics are all accessible without a subscription. The critical use case for betting is the game-by-game splits: you can filter a team’s performance in cold weather, as road underdogs, in divisional games, or against above-average defences. Each of those filters is a proxy for the conditions you’re evaluating in the current week’s matchup.
Football Outsiders publishes DVOA — Defence-adjusted Value Over Average — which measures team performance relative to opponent quality rather than absolute results. A team with a high DVOA has been efficient against strong opponents; a team with a low DVOA has struggled despite what their win-loss record suggests. DVOA correlates with future performance better than raw stats or even points scored. Weekly updates are free; their database and split versions require a subscription, but the headline numbers alone are a meaningful input.
Next Gen Stats is the NFL’s official analytics platform, publishing player-tracking data including completion percentage over expectation for quarterbacks, yards after contact for running backs, and separation metrics for receivers. It’s available free on the NFL’s website. The betting application is primarily prop-based: a quarterback showing consistently high completion percentage over expectation is outperforming his completion rate, which means prop lines based on raw completion rate may be underpricing him.
Sharp Football Stats publishes situational passing and rushing splits, pace data, and third-down efficiency numbers. The pace data is particularly valuable for totals betting — knowing which games pair a fast-paced offence against a team that allows quick scoring drives gives you a structural reason to lean over. This is data most casual punters aren’t checking, which is precisely why it retains some predictive value.
Weather services — specifically hourly forecast data for NFL stadiums — are arguably the most actionable free data source for same-day betting. A wind speed of 20 mph hitting a dome team’s first outdoor game of the season is a material factor. Most UK punters know weather matters; few check it systematically with enough lead time to get on the total before it moves.
Premium Tools and Whether They’re Worth the Subscription
Pro Football Focus (PFF) is the most influential paid analytics service in the NFL industry and generates grades for every player on every play. The grades are controversial — they’re produced by analysts making subjective assessments on many plays — but as a directional measure of player quality they’re better than most alternatives. The betting application is clearest in prop markets: a wide receiver with a high PFF receiving grade against a cornerback with a low PFF coverage grade is a meaningful contextual input for a receiving yards total prop.
The PFF subscription isn’t cheap, and for recreational UK punters it may not be justified purely on the basis of betting research. The question to ask is whether the value of the information exceeds the cost of the subscription given your typical stake levels. If you’re placing £20-50 per bet, a £150 annual subscription needs to add roughly 2-3 units of profit per year to pay for itself — which requires that PFF data genuinely improves decision-making in ways that free alternatives don’t. Many recreational punters can get sufficient value from free tools used systematically.
Stathead (part of Sports Reference) is a subscription service that unlocks advanced query capability on Pro Football Reference data. For building custom game-situation filters, it’s the most powerful tool available. If your research process involves pulling a lot of historical situational data — third-down conversion rates against specific defensive schemes, for instance — Stathead is significantly more efficient than working with public tables.
Applying Data to Actual Betting Decisions
The data becomes useful only when it connects to a specific bet. A common mistake is gathering metrics without a decision framework — you end up with a pile of interesting numbers and no clear view on whether the game is worth betting or which side offers value.
My research process for a specific game starts with the line and works outward. If the spread is -5.5 for a team I’m considering backing, the first question is: what does their DVOA say about whether they’re genuinely a five-and-a-half point better team than the opponent? If DVOA agrees, the spread is approximately fair and there may be no bet. If DVOA shows a larger or smaller differential, I start building a case for or against.
The prop market research is where the tools earn their place most clearly. Combining PFF grades, Next Gen Stats tracking data, and the opposing team’s defensive splits by position creates a framework for evaluating whether a passing yards total line is set correctly. A quarterback facing a poor coverage unit in a dome with no weather concern and a fast-paced opponent? The over on his passing yards deserves serious consideration. NFL prop bets in the UK covers how to translate that research into specific market selection.
The final principle: use data to generate hypotheses, not to confirm positions you already hold. If you’ve decided you’re backing the Chiefs and then start selecting metrics that support that view, you’ve used analytics as a comfort mechanism rather than a research tool. The productive version is starting with the data, letting it point toward an implication, and then evaluating whether that implication is priced correctly by the market.
Which free NFL statistics sites are most useful for pre-game research?
Pro Football Reference is the most comprehensive free resource for historical and current statistics, splits, and situational data. Football Outsiders provides DVOA efficiency metrics that outperform raw stats for predicting future performance. Next Gen Stats on the NFL’s official site offers player-tracking data including completion percentage over expectation and separation metrics. Sharp Football Stats provides situational splits and pace data particularly useful for totals research. All four together cover most of what a serious recreational punter needs before spending on subscriptions.
How do PFF grades help predict NFL prop bet outcomes?
PFF grades provide a context-adjusted measure of player performance that raw stats don’t capture. For receiver props, a high-graded receiver matched against a low-graded cornerback on the opposing team creates a documented edge that the prop line may not fully price. For defensive player props, coverage grades indicate how likely a cornerback is to allow targets and completions. The grades are directional rather than precise, but combined with snap count data and target share they improve the accuracy of player total assessments considerably.
Is Next Gen Stats data available before betting markets close?
Yes — Next Gen Stats publishes weekly updates through the week following each game, and the data is available well in advance of the next week’s betting markets closing. However, prop markets and spread lines are often adjusted by sharp money faster than public analytics tools can respond. The most actionable window for using Next Gen Stats data is mid-week through Friday, after the weekly updates have published but before significant late-week line movement driven by injury news.
Created by the ”bet on nfl Football” editorial team.